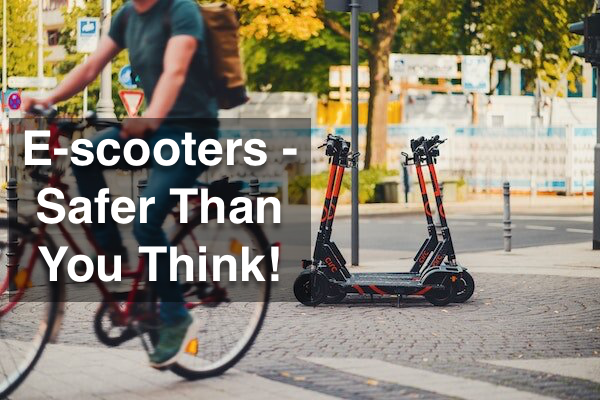
A previous post I wrote “Electric Scooter Safety - Are They Safer than Bicycles?” showed that Electric Scooters / PLEVs were as safe as bicycles.
Reasons for Electric Scooters / PLEVs being as safe / slightly safer, include:
Generally slower than bicycles.
More manoeuvrable / smaller foot print than any other powered transport.
Front & rear lighting typically built in.
As quiet as bicycles.
Upright riding position enables riders to see further ahead.
Electric Scooters / PLEVs also have the potential to make large impacts on the environment too, cutting car use. Getting good data was problematic, UNTIL NOW!

Key Data
Before I get started, here’s some key data which was used for the calculations:
Pollution
“The average petrol car on the road in the UK produces the equivalent of 180g of CO2 every kilometre, while a diesel car produces 173g of CO2/km - 18th March 2020” - CLICK HERE for Source Article.
I will be using the average of 176.5g of CO2/km.
Electric Scooters Replacing Car Rides
FleetEurope quoted "In the US, based on research of scooter company Lime, 30% (21% in Lisbon) of its riders reported to use the e-scooter to replace a car ride" - CLICK HERE for Source Article.
The Spectator quoted “One third (33.33%) of e-scooter rides replace car rides, helping reduce CO2 emissions, NOx pollutants, and clearing congestion for drivers.” - CLICK HERE for Source Article.
I know a number of people whose privately owned PLEV (electric scooter, electric unicycle, electric skateboard or one wheel) has replaced up to 70% of their car journeys!
I will be using the lower estimate of 20%, e-scooter/PLEV rides replacing car journeys..
UK Car Travel Statistics
In 2019, 873 billion passenger kilometres were travelled in Great Britain, with 84% (733 Billion) of passenger kilometres made by cars, vans and taxis. CLICK HERE for Source Article.
Average UK Car Journey Distance
There are no clear mileage statistics, but “The average car journey distance in the UK is 8.4 miles (13.5km)” which will be used for the privately owned section. CLICK HERE for Source Article.
UK E-Scooter Trials Proving Highly Successful
The UK e Scooter Trials which commenced in July 2020, have been a big success in terms of device safety.
Baroness Vere of Norbiton - Parliamentary Under-Secretary (DfT) gave the following statistics, at a House of Lords Electric Scooter Debate on 22nd April 2021:
2 Million e-scooter journeys / 5 Million kilometres travelled (Equivalent to 13 return journeys to the moon).
0 fatalities.
0 hospitalisations.
11 serious injuries (no hospitalisations).
62 slight injuries.
Typical Trial Rider ProfileLittle or no prior PLEV experience.
Limited device knowledge.
Little or no experience riding on roads.
Limited safety gear.
The above figures are based on 7,500 rental devices across 50 trials, resulting in appx. 667 kilometres per device between July 2020 & March 2021 (9 months).
Despite “per minute pricing” encouraging rental electric scooter riders to ride faster, the above are testament to how safe adult electric scooters / PLEV devices are.
UK Electric Scooter Trials Environmental Impact Estimate
The Electric Scooter trials have yielded impressive environmental results too:
Car Journeys (First 9 months)
7,500 Trial Electric Scooters
2 Million Journeys (20% car ride replacement=400,000)
400,000 Fewer Car Journeys (44,444 per month).
CO2 Reduction (First 9 months)
7,500 Trial Electric Scooters
5 Million Kilometers (20% car ride replacement=1million x 176.5g CO2 per km)
Car CO2 Reduction - 176,500kg or 173.71 Imperial Tons.
Privately Owned Electric Scooters / PLEVs
The above government figures already confirm overall safety of e scooters. Privately owned PLEVs (electric scooters, electric unicycles, electric skateboards or one wheels) devices can be even safer, for the following reasons:
Ridden more sensibly, due to significant initial outlay.
Better understanding of their devices.
Additional safety gear (elbow pads, knee pads, full face helmet etc.) worn, usually in accordance with device specifications and conditions.
Usually self train away from the general public.
Devices typically remain with the rider, not left on streets.
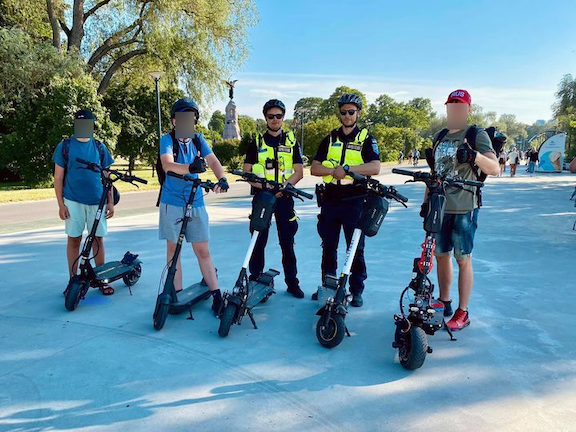
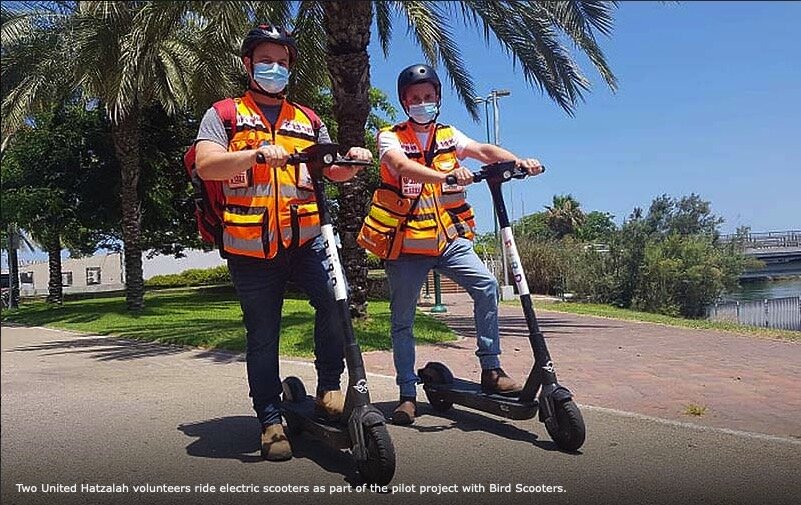
Already being used to help people with certain disabilities / injuries.
Higher power motors can improve stopping distance.
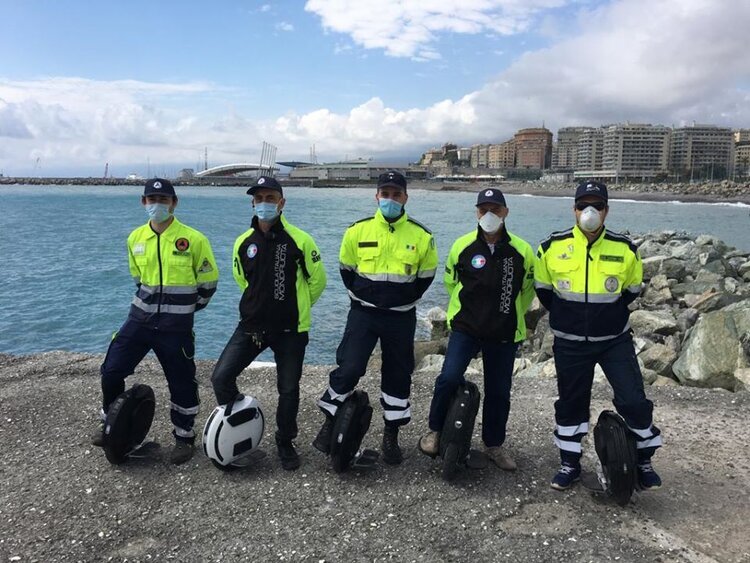
Electric unicycles are being safely ridden by all ages from 5yrs to 73yrs.
There was estimated to be around 140,000 privately owned devices during the year 2018-2019, rising to approximately 200,000 up to the point of the global pandemic.
The pandemic and UK launch of the electric scooter trials caused a boom in sales of e scooters, electric unicycles, electric skateboards and one wheels, with current conservative estimates in excess of 300,000, privately owned devices.
An article by Tom Williams of Metro.co.uk (27th May 2021) quotes “Lord Berkeley, of Labour, claimed cycling groups had told him there would be 1million e-scooters illegally on the UK’s roads by the end of the year and he feared the Government has already ‘lost the race’”.
In terms of mileage, the e-scooter trial data revealed a 9 month mileage of approx. 667km per device. Privately owned devices usually cover significantly more. It is not uncommon for privately owned devices to cover approximately 800km per month (7,200km over 9 months), substantially more, if legalised for public roads and cycle lanes.
The following calculations will be based on an estimate of 250,000 privately owned devices, with per device distances of 667km & 7,200km over nine months:
Privately Owned Electric Scooter / PLEV Devices Environmental Impact Estimate
Device Trial Mileage (667km per device)
250,000 Privately Owned Devices
3,293,827.16 Fewer Car Journeys per year (274,485 per month).
Car CO2 Reduction Per Year - 5,886,275kg (5,793.29 Imperial Tons).
Typical Device Mileage (7200km per device)
250,000 Privately Owned Devices
35,555,555.58 Fewer Car Journeys per year (2,962,962.96 per month).
Car CO2 Reduction Per Year - 63,540,000kg (62,536.29 Imperial Tons).
500,000 Privately Owned Devices - (Metro.co.uk Estimate 27/05/2021)
71,111,111.11 Fewer Car Journeys (5,925,925 per month*).
Car CO2 Reduction Per Year - 127,080,000kg (125,072.59 Imperial Tons).
The above estimates are only possible and would likely balloon, if privately owned devices were legalised for use on public roads and cycle paths.
Boris Johnson called for the devices to be legalised back in October 2015 and the Department for Transport released the “Future of Mobility: Urban Strategy - March 2019” document defining Micromobility as “The use of small mobility devices, designed to carry one or two people”.
Yet privately owned devices (such as electric scooters, electric unicycles, electric skateboards and one wheels) remain illegal except on private land, with the land owners permission.
A simple “amnesty” allowing all forms of micromobility (like NYC), while UK Government agree and implement legislation, would likely reap rapid results!
The UK remains far behind many countries who already adopted micromobility several years a go (CLICK HERE for Interactive Map).
Unless the UK Government acts fast on a number of climate change initiatives, they risk missing more climate change targets, causing further environmental and health issues.
I hope you found this post of interest feel free to post any comments below.
Thank you.
N.B - The above figures are based on limited available data, with certain conservative assumptions made.